How significant is geothermal energy in the global quest for renewable power?
Geothermal energy holds immense potential as a renewable energy source with low emissions, utilizing the Earth’s natural heat to generate electricity. With growing concerns over climate change and the need for sustainable energy alternatives, geothermal power can become a model of environmentally responsible electricity generation with minimal carbon emissions and the capability for consistent energy output, irrespective of meteorological variations. Contemporary data indicate that geothermal energy currently accounts for approximately 0.5% of global electricity production yet can address nearly 10% of global electricity requirements and serve 17% of the population, with 40 countries generating 100% of their power from geothermal sources. Additionally, geothermal energy presents a competitive proposition in the context of the capacity-weighted levelized cost of electricity (LCOE), a quintessential metric for assessing the economic feasibility of energy sources. Data from the U.S. Energy Information Administration (EIA) suggests that in 2027, the LCOE for geothermal power in the U.S. will be approximately $37.4/MWh (including tax credit). This rate is either commensurate with or potentially more favorable than electricity derived from conventional coal and natural gas combined cycle plants. The advantageous LCOE of geothermal can be attributed to its efficient operational parameters, steady energy yield, and progressive advancements in geothermal extraction techniques. It is noteworthy that while the initial capital expenditure for geothermal installations can be significant, primarily due to exploration and drilling phases, the recurring operational and maintenance expenses remain relatively moderate, culminating in a cost-effective LCOE over the infrastructure’s operational tenure.
What are the critical threats to geothermal energy realizing its full potential?
Realizing geothermal energy’s full potential does not lack technical challenges, with mineral scaling appearing prominently and persistently among them. Scaling, the accumulation, and deposition of minerals from geothermal brine onto the surfaces of geothermal equipment presents a significant impediment to efficient energy extraction. These deposits can obstruct flow, reduce heat transfer efficiency, and even result in equipment failure, leading to increased operational costs and reduced system longevity. The mechanisms that drive scaling are complex, governed by a combination of thermodynamics, kinetics, fluid dynamics, and geochemistry, with geothermal operations taking place across wide ranges of temperature (50–350 °C, medium 100-220 °C), pressure, and pH. Recent studies estimate operational costs can soar significantly due to scaling, with substantial downtime adding to the economic burden.
What are the commonly occurring geothermal scales?
Although the composition of the geothermal fluid often differs between regions and sometimes over time in the same well, major drivers of geothermal scales remain silica (SiO2) and calcite (CaCO3), while deposition of metal sulfides, sulfates, and silicates is encountered less often. Different kinds of scales are encountered in the different phases of operations, with sulfides and calcite usually precipitating early and silica forming later in the process once the production fluid is concentrated through flashing or heat is removed in the heat exchangers.
How can OLI help in mitigating risks associated with scaling in geothermal operations?
The geothermal industry recognizes the critical need to address scaling issues but lacks a comprehensive theoretical framework tailored to its operations. Traditional methods, often borrowed from other industries, have met with mixed success. This gap necessitates the development of a unified theoretical framework specifically for geothermal operations to predict scaling scenarios and formulate mitigation strategies based on the knowledge of both thermodynamic and kinetic phenomena. While thermodynamics provides information on the solution chemistry and the characteristics of the precipitating solid phase, kinetics makes it possible to account for the rate of nucleation, which is correlated to the induction time for the appearance of the solid phase from an oversaturated solution.
OLI has developed a state-of-the-art theoretical tool by combining the classical nucleation theory (CNT) [1,2] with OLI’s proprietary Mixed-Solvent Electrolyte (MSE) [3,4] model to assess induction time. The strength of the MSE framework lies in its ability to model the solution chemistry of multi-component solutions over a wide range of solution conditions while explicitly considering prevailing hydrated and anhydrous solids in conjunction with aqueous speciation. Such an approach allows for accurate estimates of solubilities and scaling indexes for various solids, including the scale-forming ones. The scaling index is a key parameter and input for scaling kinetic assessment, which helps deduce the supersaturation level of a specific solid in the solution.
Thermodynamic modeling of silica and calcite scales over wide ranges of operational conditions
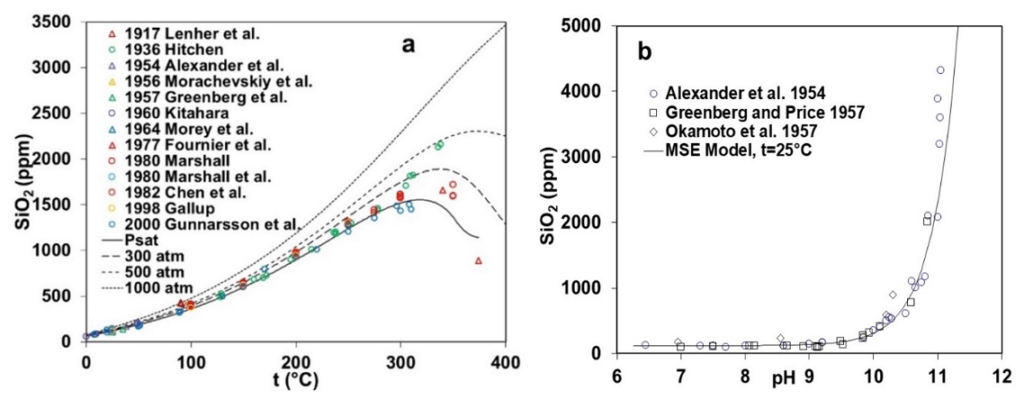
Figure 1 illustrates the experimental data and MSE model calculations for the solubility of silica over a wide range of process conditions as a function of temperature, pressure, and pH. Figure 1a elucidates the trend associated with the experimental solubility data for amorphous SiO2 between 0 and 400°C at the saturation pressure, while Figure 1b captures the variations of the solubility with pH from 6 to 11 at 25 °C. Solubility of SiO2 rises quite significantly (10 ppm near 25 °C to more than 1500 ppm at 300 °C) with the increase in temperature as experimental data available from various literature sources are in reasonably good agreement till 300 °C. However, significant scatter is observed at higher temperatures between 300 to 400 °C, with some data points indicating a decreasing trend mostly beyond 350 °C. The MSE framework accurately captures the trend in solubility displayed by the experimental data as Figure 1a includes the model predictions at higher pressures (300, 500, and 1000 atm) within the 0 – 400 °C temperature range. At saturation pressure and 300 atm, the model predictions also indicate a decrease in solubility for amorphous silica beyond 300 °C, although the trend disappears beyond 500 atm. Figure 1b elucidates a remarkable increase in the solubility of amorphous silica as a function of pH at room temperature, especially in the basic pH region beyond 10. All the experimental data points available from the literature agree with each other and validate the characteristics of amorphous silica solubility. The solubility of amorphous silica as a function of pH is well captured through the MSE model as it reproduces the experimentally observed trend.

Figure 1: Solubility of amorphous SiO2 as a function of (a) temperature (0-400 °C) and pressure (up to 1000 atm) and (b) pH (6-11) at room temperature (25 °C).
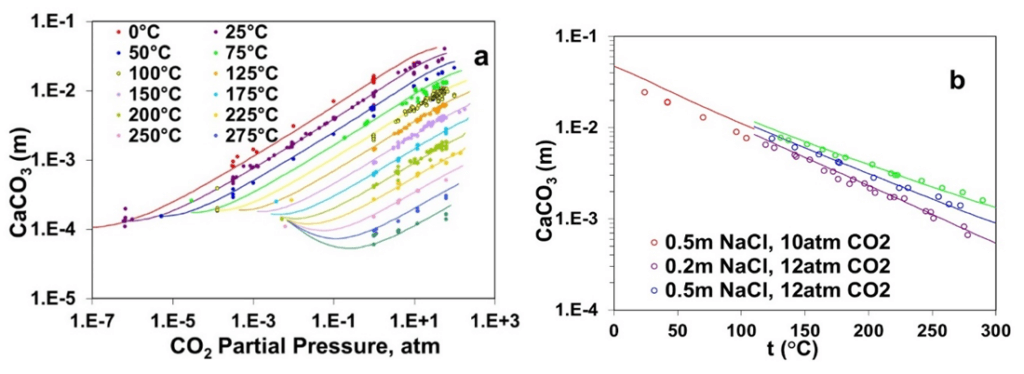
Figure 2a elucidates the strong effect of the partial pressure of CO2 on the solubility of calcite across temperatures ranging from 0°C to 300 °C where the solubility of calcite decreases with increasing temperatures at a constant CO2 partial pressure but generally increases with increasing CO2 partial pressure. The solubility behavior of CaCO3 has been reproduced using the MSE model by explicitly considering the acid-base behavior of carbonate/bicarbonate ions in the solution phase. Furthermore, Figure 2b demonstrates the effect of NaCl on the solubility of CaCO3, which increases with NaCl concentration at a constant CO2 partial pressure. The MSE model reproduces the dependence of CaCO3 solubility on the presence of NaCl quite accurately.

Figure 2: Calculated and experimental solubility of calcium carbonate as a function of (a) CO2 partial pressure and (b) NaCl concentrations (0.2 m -1.0 m) up to 275 °C.
Induction time kinetic modeling of calcite scales
The precipitation of a mineral from an oversaturated solution involves two distinct stages: nucleation, a stage of solid formation via a reaction between the dissolved constituents, and crystal growth, a stage during which the solid grows via a reaction/ aggregation with the dissolved nucleus. The duration of this process is reasonably estimated by the “induction time,” which is classically defined as the time that passes from the creation of oversaturation with regard to a solid phase and the detection of that phase in the system due to precipitation.
Induction time for calcite scale has been calculated using the CNT incorporating the scaling index obtained while reproducing the phase behavior of CaCO3-containing systems. Figure 4 illustrates experimental induction times for the calcite scale as a function of the inverse square of its saturation index at different temperatures between 25 to175°C. The induction time curve splits into two nearly linear parts. The section near equilibrium (higher SI-2 values) is influenced primarily by heterogeneous nucleation. In comparison, the section farther from equilibrium (lower SI-2 values) is controlled by homogeneous nucleation. Homogeneous nucleation occurs within the solution, while heterogeneous nucleation happens on pre-existing surfaces, like solid impurities or existing crystals. In Figure 3, experimental data indicates that as the supersaturation of the solid (calcite) in the solution increases, the induction time decreases exponentially and is greatly influenced by temperature (4 to 175°C). In all scenarios, a temperature rise corresponds to a marked reduction in the induction period, resulting from heightened supersaturation due to a drop in solubility limits and an uptick in the nucleation rate. The MSE+CNT theoretical approach within OLI simulation platform provides a good representation of the available experimental data while capturing the essential trends.

Figure 3: Calculated and experimental induction time for calcite scale at room and elevated temperatures in the presence of background electrolyte (NaCl)
Modeling the effect of common inhibitors for calcite scale mitigation
While silica scaling risk is commonly mitigated through a “pH-modification” approach, calcite scaling is averted by a traditional down-hole squeezing treatment method where the scale inhibitor is adsorbed on the rock to periodically impair calcite nucleation. Inorganic phosphates, organo-phosphorous compounds, and organic polymers inhibitors such as HEDP (hydroxyethylidene diphosphonic acid), NTMP (aminotris(methylenephosphonic acid)), PPCA (polyphosphono carboxylic acid) and DTPMP (diethylenetriamine penta (methylene phosphonic acid)) are the common commercial-scale inhibitors that are used in industry for mitigating calcite scaling risk.
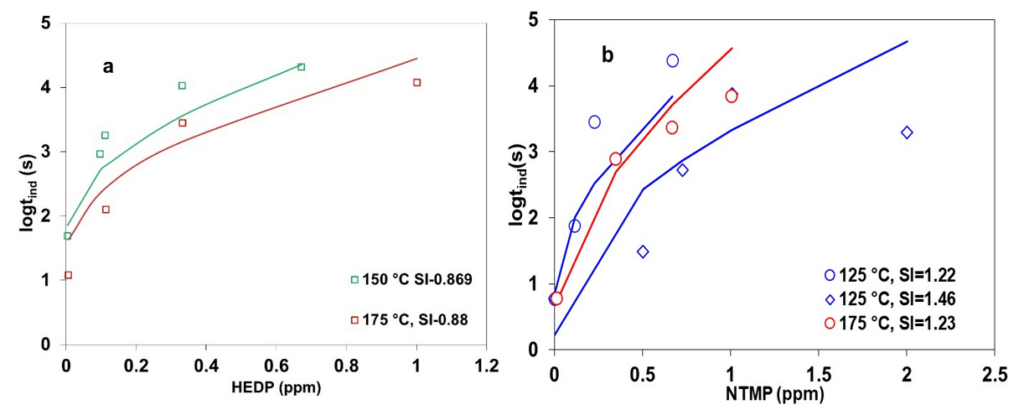
Figure 4 presents the influence of HEDP and NTMP on increasing the induction period for calcite scale formation at elevated temperatures. In particular, Figure 4a shows the effect of HEDP at 150 and 175 °C at similar supersaturation levels (scaling indexes ~ 0.89) of calcite, for which the induction time decreases with an increase in temperature. With the addition of inhibitors, the experimental induction time data display a systematically increasing trend across the temperature. The initial effect of the inhibitor at low concentrations is more pronounced than at higher inhibitor concentrations. This may be due to the attainment of optimal inhibitor concentrations to cover all active sites within the nucleus. Figure 4b presents the NTMP inhibition effect on calcite induction time at 125 and 175 °C for different scaling indexes. At 125 °C, experimental induction times for calcite in the presence of the inhibitor show a decreasing trend with an increase in scaling index from 1.22 to 1.46, attributed to the increase in saturation level. Moreover, induction time data display a systematically decreasing trend at the same scaling index of ~1.22 with an increase in temperature from 125 to 175 °C. The novel CNT+ MSE theoretical framework within OLI’s simulation platform provides a good qualitative representation of experimental data under various conditions relevant to geothermal operation.

Figure 4: Calculated and experimental induction times for calcite in the presence of (a) HEDP and (b) NTMP. Symbols denote experimental results, while lines are obtained from theoretical calculations.
The OLI System’s thermodynamic and scaling kinetics property package, based on the MSE model, is available in OLI Studio and OLI Flowsheet ESP. The V12 will contain the commonly occurring geothermal scales: silica, metal silicates, calcite, arsenic sulfide, barite, celestite, and gypsum, along with 1-hydroxyethylidene-1,1-diphosphonic acid (HEDP), amino tris (methylenephosphonic acid) (NTMP), diethylenetriamine penta (methylene phosphonic acid) DTPMP, ethylenediamine tetra (methylene phosphonic acid) (EDTPMP), 2-phosphonobutane-1,2,4,-tricarboxylic acid (PBTC), and polymaleic acid (PMA) inhibitors.
For more updates on this project and the OLI System’s thermodynamic property package, contact OLI at https://www.olisystems.com/contact-us for more information or to schedule a meeting with an OLI expert.
References
[1] A.E. Nielsen, Kristall und Technik 4 (1969) 17-38.
[2] O. Söhnel, J.W. Mullin, Journal of colloid and interface science 123 (1988) 43-50.
[3] P. Wang, R.D. Springer, A. Anderko, R.D. Young, Fluid Phase Equilib. 222 (2004) 11-17.
[4] P. Wang, A. Anderko, R.D. Young, Fluid Phase Equilib. 203 (2002) 141-176.

